Bulk vs Single-Cell and Single-Nucleus RNA Sequencing: A Comprehensive Comparative Review
Introduction
RNA sequencing (RNA-seq) has become a central tool in genomics for profiling gene expression. Traditionally, bulk RNA-seq is performed on RNA extracted from a tissue or pooled cells, producing an averaged expression profile for that population. In the last decade, single-cell RNA-seq (scRNA-seq) emerged, enabling transcriptomic analysis at the resolution of individual cells. More recently, single-nucleus RNA-seq (snRNA-seq) has gained traction as an alternative that profiles RNA from isolated nuclei, useful for cells or tissues where whole-cell dissociation is challenging. These approaches each offer unique advantages and insights: bulk RNA-seq captures a comprehensive, quantitative snapshot of gene expression at the tissue level, whereas scRNA-seq and snRNA-seq resolve cellular heterogeneity and rare cell types that bulk methods mask. This review examines the literature from the past five years comparing bulk and single-cell/nucleus RNA-seq in human studies, spanning technical methodologies, computational analysis, biological discoveries, and applications across diverse tissues. We highlight key differences in observations between the modalities – from resolution of cellular heterogeneity and rare cell populations to gene expression dynamics and pathway inference. We also discuss how these approaches can be complementary, efforts to integrate multi-modal data (including spatial transcriptomics), challenges in scalability and batch effects, and current gaps in knowledge. Finally, we propose a new research direction that leverages these insights, outlining objectives, rationale, methodologies, and expected contributions.
Technical Methodologies: Bulk vs Single-Cell vs Single-Nucleus
Bulk RNA-seq involves extracting RNA from a bulk tissue or cell mixture and sequencing it to measure gene expression averaged over all cells in the sample. It typically requires micrograms of RNA (though low-input protocols exist) and can employ poly-A selection (mRNA-seq) or rRNA depletion for total transcriptome coverage. Bulk RNA-seq library prep and sequencing yield a near-complete transcriptomic profile of the sample, detecting tens of thousands of genes (including coding and non-coding RNAs, splice variants, and gene fusions) with high quantitative accuracy. However, because it mixes all cells, signals from different cell types or states are blended. For example, bulk RNA-seq can identify overall differentially expressed genes and activated pathways between conditions, but it “fails to demonstrate the individual complexity of each cell and heterogeneity of tissues”. Important molecular signals from rare cell types may be drowned out by more abundant cells.
Single-cell RNA-seq (scRNA-seq), by contrast, isolates individual cells (often thousands per experiment) and sequences each cell’s mRNA, typically using barcoded microdroplet or microwell platforms. This yields per-cell gene expression profiles, uncovering cell-to-cell variation that bulk methods cannot detect. The breakthrough of droplet-based methods (e.g. 10x Genomics Chromium) around 2016–2017 greatly increased scRNA-seq throughput, enabling routine profiling of 10^4–10^5 cells in a run. scRNA-seq requires creating a single-cell suspension from tissue, which involves enzymatic or mechanical dissociation of the sample. A critical limitation is that tissue dissociation can introduce biases: certain fragile or large cells may be lost, and the process can stress cells, altering their transcription (e.g. inducing heat shock or immediate-early gene responses). Indeed, enzymatic dissociation for scRNA-seq has been shown to trigger a stress response that changes cellular transcriptomes, whereas snRNA-seq can avoid this artifact. Another limitation is that scRNA-seq captures only a subset of transcripts per cell – often on the order of a few thousand genes detected – due to technical dropouts and the shallow sequencing per cell relative to bulk. For instance, a single cell might have ~5–10 million mRNA molecules total, of which only a small fraction are captured and sequenced. As a result, scRNA-seq data are sparse: many genes that are lowly expressed or not active in a given cell will register zero counts (dropouts). Despite these challenges, scRNA-seq’s strength lies in its single-cell resolution: it can distinguish different cell types in a sample, identify rare subpopulations, and characterize distinct cell states even if those comprise a small fraction of the tissue.
Single-nucleus RNA-seq (snRNA-seq) isolates nuclei from tissue (by gently lysing cell membranes while keeping nuclei intact) and sequences nuclear RNA – primarily pre-mRNA still in the nucleus. This approach rose to prominence to profile archived frozen samples (where whole cells cannot be recovered) and tissues with cells that are too large, fragile, or tightly interconnected to isolate intact. For example, brain neurons and other highly connected cells (adipocytes, cardiomyocytes, etc.) are often poorly captured by scRNA-seq but are accessible via snRNA-seq. Because snRNA-seq captures nascent transcripts (with introns) from the nucleus, the data differ from scRNA-seq, which captures mostly mature cytoplasmic mRNA. In nuclei, a large proportion of reads map to intronic regions (representing unspliced pre-mRNA), whereas whole-cell data have mostly exonic reads. Practically, snRNA-seq tends to detect slightly fewer genes per cell than scRNA-seq – but this gap narrows if one includes the intronic reads in the analysis. In a direct comparison, one study found that a whole cell had on average ~11,000 genes detected (with intronic+exonic reads) versus ~7,000 genes from a single nucleus; importantly, including intronic reads improved gene detection in nuclei and allowed discriminating cell types nearly as well as whole-cell data. snRNA-seq avoids some biases of scRNA-seq: it provides less biased cellular coverage (does not selectively lose certain cell types) and does not suffer the transcriptional stress artifacts from dissociation. Moreover, it can be applied to frozen biobank specimens, greatly expanding the applicability to rare human tissues. On the other hand, snRNA-seq may miss cytoplasmic transcripts (including some fully spliced mRNAs or transcripts localized to distal cellular processes) and has its own quirks (e.g. some genes with predominantly cytosolic mRNA might appear low in snRNA-seq). In practice, scRNA-seq and snRNA-seq are often complementary: snRNA-seq recovers cell types (like neurons or adipocytes) that scRNA-seq under-represents, while scRNA-seq may capture certain immune cells or rapidly induced transcripts better. Combining both approaches on the same tissue can yield a more complete picture of the cell populations present.
Throughput, Cost, and Practicality: Bulk RNA-seq is relatively cost-effective and straightforward when analyzing many samples – library prep and sequencing are done per sample, and the data output per sample is a single aggregated profile. In contrast, single-cell and single-nucleus methods generate data for hundreds to tens-of-thousands of individual cells per sample, which is far more data-rich but also more expensive and computationally intensive. A typical scRNA-seq experiment might sequence 5,000–50,000 cells, but if one needs to profile many donors or conditions, the cell count (and sequencing cost) grows substantially. Therefore, bulk RNA-seq remains useful for large clinical cohorts or initial screens, whereas single-cell approaches are often applied to smaller cohorts or specific specimens to gain deeper insights into cellular composition. Notably, recent droplet-based methods have improved scalability (processing 1e5–1e6 cells in one run has been demonstrated), and multiplexing techniques (labeling cells from different samples) allow multiple samples to be profiled in one experiment to reduce cost per sample. Still, sc/snRNA-seq data generation and analysis require more specialized protocols and infrastructure than bulk methods.
Computational and Analytical Differences
The data from bulk vs single-cell/nucleus RNA-seq demand distinct analytical approaches. Bulk RNA-seq produces one expression vector per sample (averaged over potentially millions of cells), whereas scRNA-seq yields matrix-shaped data: thousands of cells (observations) by thousands of genes (features). Consequently, the statistical frameworks for analysis diverge.
Bulk RNA-seq analysis typically involves aligning reads to a reference genome or transcriptome (or using pseudo-alignment quantifiers), yielding gene-level counts for each sample. These counts are then normalized for library size, and differential expression (DE) between conditions or groups is assessed using statistical models (e.g. negative binomial models in tools like DESeq2 or edgeR, or linear models with voom/limma) treating each sample as one data point. Bulk data usually have a modest number of samples (tens to hundreds), so analyses focus on between-sample variation. Key steps include quality control at the sample level, batch effect correction if needed via covariate modeling or methods like ComBat, and gene set enrichment or network analysis on the DE genes to interpret pathways. Because bulk provides an average across cells, one can identify highly regulated pathways and robust gene signatures that distinguish conditions, but one cannot directly attribute those changes to specific cell types. Bulk data are often integrated with phenotype data in systems biology approaches, but there is no need for clustering or cell-type identification as in scRNA-seq.
Single-cell RNA-seq analysis is considerably more complex. The raw data first require demultiplexing and preprocessing (e.g. using the Cell Ranger pipeline or similar) to produce a gene expression count matrix for individual cells. A series of quality control filters are applied to remove low-quality cells or technical artifacts (such as empty droplets, cell doublets, or cells with high mitochondrial RNA indicating damage). Next, normalization is performed – often adjusting each cell’s counts for sequencing depth and using strategies to mitigate dropout distortions. Unlike bulk data, single-cell data are highly heterogeneous and sparse, with many zero counts. Specialized normalization and imputation techniques (e.g. scran’s pooling normalization or deep-learning methods) may be used to handle the zero-inflation and variability. A common practice is to perform dimensionality reduction (such as PCA) on the data and then cluster cells based on their expression profiles to identify putative cell types or states. Each cluster can be annotated by examining marker genes (genes enriched in that cluster). This clustering step has no analog in bulk RNA-seq, since bulk doesn’t have single-cell resolution.
For comparing conditions in single-cell data (e.g. disease vs control), one approach is pseudo-bulk analysis: aggregate the single-cell data to the sample level or per-group level. In pseudo-bulk, gene counts from all cells of a given cell type (or all cells in a sample) are summed or averaged to create a “bulk-like” profile, which can then be analyzed with bulk RNA-seq methods. In fact, recent benchmarks show that pseudo-bulk approaches (treating each sample’s aggregate as an independent replicate) tend to yield more robust DE results than methods that treat individual cells as independent samples. This is because treating each cell as an observation violates independence (cells from the same individual are correlated) and can inflate false positives; pseudo-bulk or mixed models properly account for the hierarchical structure of the data. Thus, many modern scRNA-seq studies use a combined approach: identify cell clusters, then perform differential expression within each cell type between experimental conditions by aggregating counts per donor. This preserves single-cell resolution for cell type identification but uses bulk-like statistical power for DE testing.
Beyond differential expression, scRNA-seq enables analyses not possible in bulk data, such as cell trajectory (pseudotime) analysis and RNA velocity. Trajectory inference algorithms (e.g. Monocle, Slingshot) arrange cells along a predicted lineage or time axis based on gene expression, which can reveal dynamic changes during processes like differentiation or disease progression. These methods leverage the asynchronous progression of cells captured in a snapshot to infer temporal sequences – something bulk cannot do because temporal information is lost in population averaging. RNA velocity is another innovative analysis that uses the ratio of unspliced (nascent) to spliced mRNA for each gene in each cell to predict the future state of the cell’s transcriptome. It provides a vector of transcriptional “movement” for each cell, indicating up- or down-regulation trajectories. These tools allow single-cell data to suggest causal or temporal relationships (e.g. which genes turn on early vs later in a process), insights that bulk data cannot resolve since bulk gives only an averaged endpoint.
Single-nucleus RNA-seq data analysis is similar to scRNA-seq, with the added step of handling intronic reads. Pipelines for snRNA-seq often count reads mapping to introns to capture pre-mRNA. This can complicate normalization (as gene counts include nascent transcripts), but tools like DropEst or modifications of Cell Ranger handle nuclear data. Otherwise, clustering and downstream analyses proceed similarly. An important computational consideration is that snRNA-seq and scRNA-seq from the same tissue might cluster separately if combined naively, due to systematic differences (nuclear vs cytoplasmic content). Custom integration (see below) or analysis of snRNA-seq with appropriate reference datasets may be needed.
Batch effects and integration: Both bulk and single-cell RNA-seq can suffer from batch effects – systematic technical differences between runs, labs, or sample processing batches. In bulk RNA-seq, batch effects are typically addressed by including batch covariates in the statistical model or using correction methods like ComBat, and since each sample is one point, these corrections are relatively straightforward. In scRNA-seq, batch effects are more complex: each batch may cause shifts in thousands of cells’ expression, which can lead to artifactual cluster separation by batch rather than true biology. The past five years have seen an explosion of computational methods for single-cell data integration and batch correction (e.g. mutual nearest neighbors (MNN) matching, Seurat’s CCA-based integration, Harmony, Liger, and deep learning approaches such as scVI). These methods align the data from different batches or experiments into a shared expression space, so that cells cluster by cell type rather than by experiment. Proper batch correction is essential for multi-sample single-cell studies – for example, integrating scRNA-seq from multiple human donors in order to draw generalizable conclusions. A Frontiers perspective notes that many single-cell analysis advances have been adapted from bulk approaches, but also that single-cell data bring unique challenges requiring new solutions. Indeed, integration algorithms in single-cell analysis go beyond traditional bulk batch correction by sometimes using anchors or mutual nearest cells across datasets to merge cell atlases.
Cell type deconvolution: An area where bulk and single-cell analyses intersect is in silico deconvolution of bulk data. Here, the goal is to leverage single-cell expression signatures to infer the cellular composition of bulk tissue samples. Numerous tools (e.g. CIBERSORTx, Bisque, SCDC, MuSiC) have been developed to take a reference scRNA-seq dataset (with defined cell type expression profiles) and decompose bulk RNA-seq profiles into proportions of those cell types. For instance, using scRNA-seq from human heart tissue as reference, one can estimate what fraction of cardiomyocytes, fibroblasts, endothelial cells, etc., are in each bulk heart sample. This approach “synergistically combines information” from both modalities – the cell-specific resolution of scRNA-seq and the quantitative robustness of bulk data. However, it relies on having an appropriate single-cell reference (ideally from the same tissue and condition) and on marker genes that distinguish cell types. While promising, deconvolution methods are still being refined, and no single method has become standard. They struggle when cell type signatures are similar or when bulk samples contain cell types not represented in the reference. Nonetheless, this is a powerful example of how bulk and single-cell data can be integrated computationally to yield insights (e.g. estimating immune infiltration in tumors from bulk tumor RNA-seq using scRNA-seq of the tumor microenvironment).
In summary, scRNA-seq and snRNA-seq demand more elaborate analyses – clustering, high-dimensional visualization, specialized differential testing – but they open the door to analyses of cellular heterogeneity, state transitions, and cell–cell interactions that bulk approaches cannot directly achieve. Bulk RNA-seq analysis remains simpler and often more statistically robust given larger RNA counts and less noise; it excels at detecting subtle changes in gene expression and is well-suited for pathway analysis at the tissue level. The two approaches yield different but complementary views, and appropriate computational strategies can connect these views (for example, using pseudo-bulk methods to compare to bulk results, or using scRNA-seq to interpret bulk data via deconvolution and vice versa).
Biological Insights and Discoveries
One of the most profound differences between bulk and single-cell modalities lies in the biological insights they enable. Bulk RNA-seq measures average gene expression across all cells in a sample, which is powerful for identifying overall changes (e.g. “Pathway X is upregulated in diseased tissue vs normal”) but can obscure the contributions of individual cell types. Single-cell and single-nucleus RNA-seq, by profiling each cell, reveal the cellular heterogeneity underlying those average signals. In human studies over the past five years, this has led to numerous discoveries of new cell types, subpopulations, and cell states across tissues that bulk analysis could not resolve. Below, we compare how bulk vs single-cell approaches differ in key discovery areas, and how they provide complementary perspectives on biology:
Cellular Heterogeneity and Rare Cell Types
Bulk RNA-seq treats the tissue as one homogeneous sample – thus it cannot distinguish whether a gene’s expression change is coming from all cells in the tissue or just a subset. For example, if a bulk tumor sample shows high expression of a gene signature, it’s unclear if every tumor cell expresses those genes at moderate levels or if a small subset of cells express them at very high levels. scRNA-seq answers this by directly measuring each cell. It has been a “revolutionary” tool for dissecting heterogeneity: since about 2017, scRNA-seq has been widely used to profile tumors, revealing diverse subpopulations of cancer cells and tumor-infiltrating immune/stromal cells that were previously masked. In cancer, this has uncovered phenotypic plasticity – for instance, in a single tumor bulk sample, scRNA-seq can find malignant subclones with distinct gene expression programs, or a small cluster of stem-like cells that drive relapse. These rare populations (e.g. drug-resistant cells present at 1% frequency) could never be identified by bulk methods alone. Likewise in normal tissues, scRNA-seq has led to the discovery of novel cell types or previously unrecognized subtypes – for example, new neuron subtypes in the human brain, rare specialized lung cells (such as pulmonary ionocytes discovered in 2018), and unique immune cell states in blood. Bulk RNA-seq simply averages over all these, akin to tasting a smoothie where individual ingredients are indiscernible.
A concrete example: cardiac transcriptomics. Bulk RNA-seq of heart tissue yields an average of cardiomyocytes, fibroblasts, endothelial cells, etc. Studies using bulk data identified major differences between healthy and failing hearts, like upregulation of fibrosis-related genes and downregulation of contractile genes. But it was unclear which cell types were responsible for which changes. Recent single-cell studies of human heart tissue have unveiled a rich heterogeneity of cardiac cell types and states – for instance, multiple fibroblast subpopulations (some involved in scar formation, others in homeostatic maintenance) and distinct subtypes of cardiomyocytes with different stress response profiles. scRNA-seq in heart failure patients revealed rare cell types (e.g. resident immune cells, specific endothelial subpopulations) that bulk never distinguished. Thus, scRNA-seq provides a high-resolution “fruit salad” view, where each cell type’s contribution can be identified, versus bulk’s blended average.
Single-nucleus RNA-seq extends this to tissues where scRNA-seq had gaps. For instance, human brain studies have used snRNA-seq to catalog neuronal cell types in postmortem brain samples (fresh tissue is not available). Bulk brain RNA-seq from diseases like Alzheimer’s yields differential expression profiles, but interpreting those is difficult – is a downregulated synaptic gene due to loss of neurons or a change within neurons? SnRNA-seq answered questions like this by showing, for example, that in Alzheimer’s, certain neuron subtypes are selectively vulnerable (their numbers decrease, lowering their marker expression in bulk data) while glial cells activate specific inflammatory pathways. Moreover, some cell types that could not be studied in live single-cell prep (like fragile neuronal subpopulations) are accessible with nuclei. A 2022 review notes that snRNA-seq tends to recover “attached” cell types in tissues better, whereas scRNA-seq of dissociated tissue often yields a biased over-representation of immune cells which are easier to isolate. In other words, a dissociated tissue might disproportionately yield macrophages or lymphocytes (because they survive the process), while dropping out large epithelial or neuronal cells; nuclei isolation recovers those large cells in nuclear form, balancing the representation. This difference in cell yield can lead to contrasting observations: a bulk tissue sample rich in epithelial cells might have its main signals from those cells, but a scRNA-seq from the same tissue could erroneously emphasize immune gene expression if mainly immune cells were captured. SnRNA-seq corrects this bias, and studies combining scRNA-seq and snRNA-seq have demonstrated more comprehensive cell atlases.
In summary, bulk RNA-seq excels at identifying dominant signals but misses heterogeneity, whereas scRNA-seq/snRNA-seq expose the complexity of cellular composition. Rare cell types (e.g. a rare stem cell in a tissue) can be profiled by scRNA-seq to find unique markers and functions, which bulk would have likely missed entirely. This has biomedical importance: for instance, identifying a rare cell population that expresses a drug target could explain a response or resistance mechanism. A recent single-cell study in lung cancer found that a small subset of CD8^+ T cells with an “exhausted” but proliferative phenotype was associated with better immunotherapy response – a subtle insight only possible by scRNA-seq. Bulk RNA-seq of the tumor would not separate those T cells’ signal from the rest. On the other hand, if a biological process uniformly affects all cells of one type, bulk and single-cell might both detect it – bulk will show a strong tissue-level change, and scRNA-seq will show that each cell of that type shifts. But if the process affects only a subset, bulk might show only a muted average change, whereas scRNA-seq pinpoints a subset drastically changing (and perhaps another subset doing the opposite, changes that cancel out in bulk average). These scenarios have been reported in immune responses where only some cells activate a pathway and others don’t, leading to bulk expression looking modest even though at single-cell level it’s a binary on/off in different cells.
Gene Expression Resolution and Cell-Specific Patterns
Bulk and single-cell approaches offer different resolutions of gene expression information. In bulk RNA-seq, each gene’s measured expression is an average across all cells. This provides a precise quantitative measure of that gene’s overall abundance in the tissue, often with high sensitivity for lowly expressed genes (since transcripts from all cells are pooled). Bulk sequencing depth can be allocated to cover the transcriptome deeply, detecting even weakly expressed transcripts (as long as they are present in enough cells). scRNA-seq has a lower per-cell sensitivity – many genes with moderate bulk-level expression might be missed in a fraction of single cells due to dropouts. However, scRNA-seq adds a distributional perspective: instead of a single number per gene per tissue, we get a distribution of that gene’s expression across cells. This enables distinguishing which cells express the gene and the variability of expression.
For example, consider a transcription factor gene that in bulk is moderately expressed in a tissue. scRNA-seq might reveal that only 30% of the cells (say, all of them a particular cell type) actually express that transcription factor at high levels, while it’s off in others. Bulk would report an average that dilutes that, whereas scRNA-seq shows a bimodal pattern (on in some cells, off in others). This is critical for understanding gene regulation: some pathways may appear only modestly active in bulk but in reality are highly active in a specific subpopulation. Additionally, scRNA-seq can identify co-expression patterns within single cells – sets of genes that tend to be expressed together in the same cells – which can define cell states or types. Bulk co-expression analysis (e.g. WGCNA modules) finds genes that co-vary across samples, which often correspond to cell-type specific modules or pathway modules. But single-cell co-expression finds genes co-varying across cells; this can capture different information, like genes that mark a particular activation state present in some cells and not others within one sample.
Pathway and network inference also differ. Bulk RNA-seq after differential expression can feed into pathway enrichment analyses (Gene Ontology, KEGG, GSEA) to tell us which biological processes are up- or down-regulated in the tissue. This is useful to get a broad sense of biology (e.g. “inflammasome pathway genes are elevated in diseased vs healthy tissue”). Single-cell data allow pathway analysis at the level of cell populations – one can ask, within specific cell types, which pathways are altered under condition A vs B? This increases resolution: perhaps the bulk tissue shows enrichment of an interferon pathway; single-cell analysis might reveal that interferon-response genes are up in microglia and endothelial cells specifically, but not in neurons, for example. This kind of pinpointing is invaluable in complex organs. Tools exist to score individual cells for pathway activation (e.g. calculating a gene set score per cell) or to perform enrichment on cluster-specific DE genes. These approaches have shown that certain pathways are cell-type specific in their activation. In tumors, bulk RNA-seq might indicate activation of TGF-β signaling overall; scRNA-seq can show that cancer-associated fibroblasts are the ones with high TGF-β expression and response, whereas malignant cells might not strongly activate that pathway. In short, scRNA-seq gives cellular context to pathway analysis.
A striking example of contrasting insights is with immediate early genes (IEGs) and stress response genes. A study comparing scRNA-seq and snRNA-seq in mouse cortex found that some IEGs (like Fos, Egr1, Arc) were up to 10-fold more highly expressed in dissociated cells than in nuclei. This suggests that the process of making a single-cell suspension triggers an artificial activation of these genes (a well-known effect of ex vivo cell stress). Bulk RNA-seq of tissue (especially if done on quickly preserved tissue) might not show such an induction because the cells were not stressed in the same way. Meanwhile, snRNA-seq, which avoids whole-cell dissociation, did not show such high IEG expression. Thus, bulk and single-cell can sometimes give seemingly conflicting signals for certain genes: e.g. bulk tissue might show lower expression of stress-response genes than an equivalent scRNA-seq experiment, because the latter includes preparation artifacts. Understanding these differences is important for correct interpretation. In this case, snRNA-seq provided a control and indicated the scRNA-seq signal for IEGs was likely artifactual.
Conversely, the same comparison showed that certain long, neuronal transcripts were better detected in nuclei – many synaptic or connectivity-related genes had higher “nucleus-enriched” expression, presumably because they are large transcripts that might be partially degraded or lost in cytoplasm capture but remain in the nucleus. They found ~159 genes significantly higher in snRNA-seq vs scRNA-seq (after accounting for other factors), often related to neuronal identity and long genes, whereas thousands were higher in scRNA-seq (including housekeeping genes and ribosomal proteins). Bulk RNA-seq, which captures the complete RNA (nuclear + cytosolic), might actually detect both sets – but bulk can’t tell that one set came largely from nucleus. These differences underscore that technical aspects can influence biological observations: one must be cautious to attribute differences to biology vs technical bias.
Despite these caveats, both bulk and single-cell/nucleus RNA-seq have led to important biological and biomedical discoveries in the past five years. Bulk RNA-seq, being a mature technology, has been applied to thousands of human samples (e.g. GTEx project profiling bulk RNA of ~50 tissues across hundreds of individuals, or TCGA profiling bulk tumors). These efforts yielded broad insights like tissue-specific gene expression patterns, disease vs normal gene signatures, and expression quantitative trait loci (eQTLs) linking genetic variants to gene expression. However, bulk studies often raised further questions – for example, if a gene is associated with a disease in bulk data, what cell type is driving that? Single-cell studies came along to answer many such questions:
- In immunology, bulk RNA-seq of blood identified overall transcriptomic changes during infections or vaccination, but single-cell RNA-seq has identified the specific immune cell subsets (B cell, T cell, monocyte subsets) responsible for those changes and even discovered new subsets (e.g. an “age-associated B cell” subset with unique transcriptome).
- In neuroscience, bulk RNA-seq in brain disorders provided lists of DE genes, while single-nucleus RNA-seq pinpointed that in diseases like autism or schizophrenia, certain neuronal subtypes or supporting cells (astrocytes, microglia) show those transcriptional changes, suggesting targeted mechanisms.
- In developmental biology, bulk RNA-seq could measure gene expression over time or between tissues, but scRNA-seq allowed mapping differentiation pathways by capturing intermediate cell states and ordering them in pseudotime. This led to discovery of transient cell states (e.g. pro-regenerative cell states in heart injury, or intermediate progenitor states in neurogenesis) that bulk could not isolate because they exist only fleetingly or as a minority of cells at any given time.
- In cancer biology, as mentioned, scRNA-seq revealed intratumoral heterogeneity: for instance, a bulk transcriptional subtype of breast cancer might actually comprise a mix of different single-cell states; single-cell analysis showed tumors often contain multiple coexisting cell states (e.g. some proliferative, some invasive) even if bulk classification labels the tumor as one subtype. This has implications for therapy – bulk genomics might mislead if it averages over cells with different drug sensitivities.
Importantly, bulk and single-cell approaches are complementary in many cases. Bulk RNA-seq remains the gold-standard for quantitative comparison of gene expression across large numbers of samples (for example, in clinical trials or epidemiological studies with hundreds of patients, bulk is feasible whereas single-cell on all of them would be cost-prohibitive). Single-cell data can then be used to interpret the bulk results. A vivid example comes from cancer prognosis studies: researchers have taken gene expression signatures discovered via scRNA-seq (say, a set of genes characterizing an aggressive cancer cell subpopulation) and evaluated those signatures in large bulk tumor cohorts to see if patients whose bulk tumors have that signature enriched have worse outcomes. This kind of cross-modality validation combines the strengths of both – the specificity of single-cell insights and the statistical power of bulk cohorts. In one study in head and neck cancer, single-cell and spatial transcriptomics data were used to identify a “cell-death related” gene signature of tumor cells; then bulk RNA-seq from ~500 patients (TCGA) was used to build and test a risk score based on that signature, successfully stratifying patients by survival. Such integrative studies are becoming more common as researchers recognize that single-cell discoveries need bulk confirmation in larger patient cohorts for clinical relevance.
Cell–Cell Interactions and Microenvironment
An area where scRNA-seq particularly shines is illuminating cell–cell interactions. Bulk RNA-seq provides essentially no direct information on how different cell types within a sample might be interacting, because the signals are all mixed. At best, one could correlate bulk expression of a ligand gene with bulk expression of a receptor gene across samples, but this is indirect. Single-cell RNA-seq can identify which cell types express potential ligand and receptor pairs, enabling inference of intercellular communication networks within a tissue. For example, in a tumor microenvironment, scRNA-seq might reveal that tumor cells highly express TGF-β ligands while neighboring fibroblasts express TGF-β receptors and downstream targets – suggesting a signaling interaction. Numerous computational tools (CellPhoneDB, NicheNet, etc.) have been developed to systematically infer such ligand-receptor interactions from single-cell data. These analyses have led to new hypotheses about cellular crosstalk – for instance, how immune cells are modulated by cancer cells or how stromal cells support tumor growth – that were invisible in bulk data.
Additionally, single-cell data combined with spatial information has provided unprecedented views of tissue organization. While scRNA-seq alone loses spatial context (cells are analyzed outside of their tissue location), methods to integrate scRNA-seq with spatial transcriptomics have emerged. Spatial transcriptomics (e.g. 10x Genomics Visium or Slide-seq) measures gene expression in situ on tissue slices, albeit currently at near-single-cell or multi-cell “spot” resolution. By integrating scRNA-seq (for cell-type identification) with spatial data, researchers can map where the cell types are and how they interact in space. One landmark study integrated spatial transcriptomics with scRNA-seq in pancreatic cancer to reveal the spatial organization of malignant, immune, and fibroblast cells and identified distinct neighborhoods correlated with prognosis. Bulk RNA-seq, in contrast, has no spatial resolution — it’s like having all cells mixed in a blender. Thus, the combination of single-cell resolution with spatial mapping is opening new frontiers in understanding tissue architecture (e.g. in the brain’s layered structure or tumor invasive margins). This is considered one of the “next-generation” advances building on the single-cell revolution.
Even without dedicated spatial data, single-cell analyses can sometimes infer spatial relationships. For instance, gradients of gene expression across cells or the presence of known location-specific markers can hint at spatial position (like cortical neuron layer markers). But dedicated spatial methods are preferable and are increasingly used alongside scRNA-seq.
In summary, the microenvironmental context is far better probed with single-cell approaches. Bulk RNA-seq can certainly detect the presence of multiple cell types (through cell-type-specific transcripts), but it cannot separate their contributions or interactions. Single-cell approaches have, in human tissues, revealed complex ecosystems: e.g. in fibrotic lung disease, scRNA-seq identified pathological fibroblast subtypes expressing high levels of chemokines that attract immune cells, something bulk lung profiles could only weakly suggest. In infectious disease, single-cell profiling of blood during infection can show which cells produce inflammatory cytokines and which cells express the corresponding receptors, mapping a network of immune signaling in the patient – whereas bulk blood RNA-seq would just list cytokine genes as upregulated with no clarity on source or target cell.
To illustrate complementary use: a bulk transcriptomic signature of “T cell inflamed” tumors (used in cancer immunotherapy research) comprises interferon-gamma stimulated genes. Bulk data can classify tumors as “hot” or “cold” based on this signature. Single-cell follow-ups reveal that signature comes specifically from CD8 T cells and some myeloid cells in the tumor; moreover, single-cell data can refine it by identifying which subtype of T cell (e.g. an exhausted CD8 T cell) drives it. This understanding helps refine therapeutic strategies (like boosting that particular T cell subset).
Table: Key Comparative Insights (conceptual summary):
- Heterogeneity: Bulk – averages it out; Single-cell – resolves it, finds new cell types.
- Rare populations: Bulk – often undetectable if below a certain fraction; Single-cell – can capture and profile them.
- Gene expression quantitation: Bulk – very quantitative for tissue-level changes, high sensitivity for lowly expressed genes if broadly expressed; Single-cell – semi-quantitative per cell, with many dropouts, but provides distribution and cell-specific expression data.
- Pathways: Bulk – overall pathway activation in tissue; Single-cell – pathway activation in specific cell types, identification of divergent pathway activity among cells.
- Interactions: Bulk – minimal info; Single-cell – infer cell-cell communication networks (especially when combined with spatial).
- Technical biases: Bulk – requires enough RNA, but no single-cell dissociation bias; Single-cell – requires viable cells or intact nuclei, subject to dissociation stress and dropout noise.
- Data scale: Bulk – one vector per sample, easier to compute; Single-cell – thousands of vectors per sample, requiring more complex analysis and data handling.
- Applications: Bulk – large cohorts, diagnostic signatures, eQTL and gene-network analyses; Single-cell – cell atlas projects, mechanistic studies of cell differentiation, identifying cellular drivers of disease.
The above points, supported by multiple recent studies, show that bulk and single-cell modalities each provide unique observations. Often, they are best used in tandem: single-cell to generate hypotheses about specific cells or genes, and bulk (on large sample sets) to validate the relevance in broader populations or clinical outcomes. We now turn to how researchers are actively integrating these approaches and the challenges that come with scaling and combining such data.
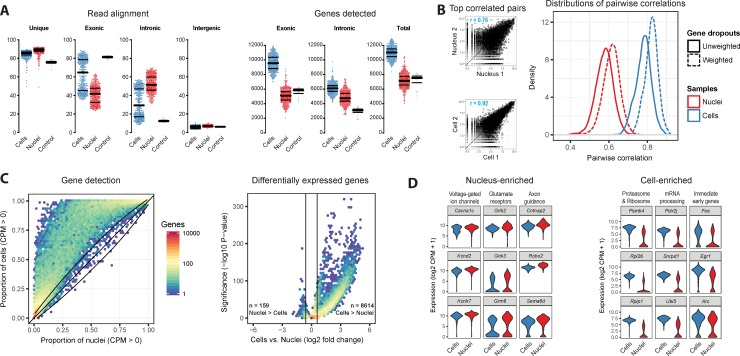
Figure: Comparison of single-nucleus and single-cell transcriptomes (example from mouse cortex). In panel (A), whole cells (blue) show higher gene detection per cell than nuclei (red) – median ~9,500 genes (exonic) in cells vs ~5,000 in nuclei, increasing to ~11k vs 7k when including intronic reads. Nuclei have a larger fraction of reads mapping to intronic regions (unspliced RNA). Panel (B) illustrates that gene expression measurements are more correlated between two similar single cells (r=0.92 for most similar pair) than between two similar nuclei (r=0.76), reflecting more technical dropouts in nuclear data. Panel (C) shows most genes are detected at equal or higher rates in cells than nuclei, and that ~20.5% of genes had significantly higher expression in cells vs only 0.4% in nuclei. Panel (D) lists examples: Nucleus-enriched genes (red violin plots) include long neuronal genes (voltage-gated channel subunits, synaptic proteins) while Cell-enriched genes (blue) include ribosomal and protein synthesis genes; notably, immediate-early genes like Fos are much higher in cells (blue) due to dissociation-induced activation. Despite these differences, both methods distinguished cell types similarly when intronic reads were included, underscoring that snRNA-seq can recover biological information comparable to scRNA-seq if analyzed properly.
Integration of Bulk and Single-Cell/Nucleus Data
Given the complementary nature of bulk and single-cell RNA-seq, a growing trend in the past few years is to integrate these modalities within studies to leverage the strengths of each. There are several strategies and purposes for integration:
-
Using scRNA-seq as reference for bulk (Cellular deconvolution): As discussed, one can computationally estimate cell type proportions in bulk samples using a reference scRNA-seq dataset. This has been applied in many contexts, for example, estimating immune infiltration in tumors or cell-type composition in blood samples. In cancer, this approach can take a bulk tumor RNA-seq (which is easier to get for hundreds of patients) and infer the abundance of T cells, B cells, cancer cells, fibroblasts, etc., using scRNA-seq data from a few representative tumors. Such deconvolution can add interpretability to bulk gene signatures (e.g. confirming that an inflammatory gene signature in bulk is due to high immune cell content). Tools like CIBERSORTx, EPIC, and Bisque (which uses regression with single-cell references) have shown success in replicating known compositions. However, challenges include differences in sample processing (bulk and single-cell experiments might have batch differences) and incomplete reference cell profiles. Improvements are ongoing, and future methods may incorporate spatial data as well to refine location-specific deconvolution.
-
Validating scRNA-seq findings in bulk cohorts: Single-cell studies often have relatively few samples (because of cost and complexity, perhaps 3–10 patients in a typical experiment). To ensure that findings generalize, researchers validate in larger bulk datasets. For instance, if scRNA-seq identifies a new cell state characterized by a set of genes, one can test if those genes collectively correlate with disease severity in bulk data from dozens of patients. This was exemplified in the head & neck cancer study where a cell-death gene signature derived from single-cell analysis was confirmed as prognostic using bulk RNA-seq from hundreds of tumors. Similarly, single-cell discovered gene modules in fibrosis have been shown to predict outcomes when scored in bulk transcriptomes of patient biopsies. This integration brings single-cell insights to the translational realm of biomarkers and diagnostic signatures.
-
Joint dimensionality reduction of bulk and single-cell data: In some cases, investigators have concatenated bulk and single-cell data for joint analysis. For example, converting bulk data into “pseudo-cells” or average expression profiles and plotting them in the same PCA or UMAP space as single cells. This can visually show how bulk samples relate to cellular states – e.g. a bulk sample might lie near a particular cluster of cells, indicating that cluster dominates the bulk profile. More formally, methods have been proposed to factorize bulk gene expression in terms of single-cell-derived metagenes or vice versa.
-
Integrated modeling of multi-sample single-cell data: Another angle is analyzing many single-cell datasets (from multiple individuals) together, which can blur the line between bulk and single-cell approaches. For instance, creating a “pseudobulk” per individual per cell type matrix (genes × individuals for each cell type) allows using bulk-style analyses (like finding eQTLs or condition effects) within each cell type. This has led to the field of single-cell eQTL mapping, where one performs genetic association on gene expression but separately for each cell type, something not possible from bulk data alone. Early studies (2019–2021) in blood and tissue have shown that some genetic effects on gene expression are cell-type-specific, which bulk eQTLs couldn’t detect because they average the effect across all cells.
-
Multi-omic integration: Though beyond pure RNA-seq, many studies now combine bulk or single-cell transcriptomics with other modalities (e.g. epigenomics, proteomics). For example, a study might do scRNA-seq and bulk ATAC-seq (chromatin accessibility) on the same samples, to link chromatin changes to cell-specific expression. Or bulk proteomic data might be integrated with scRNA-seq to validate that mRNA changes translate to protein in certain cell types. Multi-omic integration is a broad area; within transcriptomics, the integration with spatial transcriptomics stands out.
-
Spatial + scRNA-seq + bulk integration: This particular combination is emerging as a powerful approach and was explicitly noted as an underexplored area. A few very recent studies have attempted to bring all three together. For example, a 2024 colorectal cancer study integrated bulk RNA-seq data from 22 cohorts with single-cell RNA-seq and spatial transcriptomics from representative tumors. They used single-cell data to define cell-type gene signatures, spatial transcriptomics to map those cell types in tumor tissue (and how chemotherapy reshaped their spatial distribution), and bulk cohorts to develop machine-learning models predicting patient outcomes based on those cell-type signals. Such a comprehensive integration can connect the molecular details at single-cell level to clinically measurable signals at bulk level. We are likely to see more of these “multi-scale” integrative studies. Another example is a 2024 study in head & neck cancer which combined scRNA-seq, spatial transcriptomics, and bulk RNA-seq to derive a cell-death signature for prognosis (as described). These are still relatively novel – the computational frameworks to seamlessly integrate across these three levels are in early stages, but the concept holds great promise for bridging basic and clinical research.
Despite successful examples, integrating bulk and single-cell data also presents challenges. One challenge is data harmonization: bulk and single-cell data have different normalization and units (bulk often TPM/CPM or counts per sample, single-cell counts per cell). Some methods simply average single-cell data to make it “bulk-like”, but others try more sophisticated modeling. Ensuring that technical differences don’t confound integration is key – for instance, batch effects between bulk and single-cell must be addressed if combining directly. Another challenge is the scale mismatch: bulk has many samples but each is low-dimensional; single-cell has few samples but high-dimensional single-cell measurements. Balancing these in statistical analyses is non-trivial. Nonetheless, progress in methodologies (matrix factorization, cross-modal neural networks, etc.) is enabling better integration.
From a biological standpoint, an integrated approach provides a more complete picture: bulk RNA-seq tells us what changes happen at the tissue level, single-cell tells us how and in which cells those changes occur, and spatial data tells us where in the tissue they occur. By triangulating these, one can derive robust insights. For example, in a liver disease, bulk RNA-seq might show an increase in fibrosis-related genes; single-cell identifies which cells (hepatic stellate cells) express those and even sub-types (activated vs quiescent stellate cells); spatial shows that activated stellate cells localize around fibrotic scars. Together, this confirms a mechanism that could be targeted (e.g. blocking a ligand from scar-associated macrophages that stimulate stellate cells, which one might infer from ligand-receptor analysis in single-cell data).
Integration also extends to using one modality to cross-validate another. If bulk and single-cell results agree on certain key genes or pathways, confidence in those findings is higher. Conversely, if they disagree, that prompts investigation – is it due to technical reasons or biological complexity (like opposing changes in different cell types)? We saw an example with immediate-early genes: bulk did not show a big increase but scRNA-seq did (in some cells); understanding that difference was important to interpret whether the scRNA-seq result was real or artifact. Thus, integrating the perspectives can guard against misinterpretation that might occur if only one modality is considered.
Scalability, Throughput, and Batch Effects
As the technologies have advanced, scalability has become a pertinent issue, especially for single-cell approaches. Bulk RNA-seq is relatively easy to scale on the sample axis – sequencing 1,000 samples is mostly a matter of expense, but the computational analysis of 1,000 bulk profiles is trivial on a modern computer. Single-cell RNA-seq, on the other hand, scales on two axes: number of samples and number of cells per sample. Large initiatives like the Human Cell Atlas have profiled millions of single cells across hundreds of samples (donors). Handling millions of cells in an integrated analysis is a significant computational challenge: memory, CPU/GPU time, and data storage requirements are substantial. Methods like incremental PCA, subsampling, or more efficient algorithms (Scanpy’s AnnData, Google’s STARR-seq, etc.) have been developed to cope, but this remains a moving target. Newer cloud-based platforms and distributed computing approaches (e.g. TileDB or zarr format to store sparse matrices, or using Scanpy/AnnData with on-disk backing) help handle large single-cell datasets.
Another aspect of scalability is cost and labor. Sequencing one million single-cell transcriptomes is far more expensive than one million bulk transcriptomes (if that many samples existed). Thus, experimental design has to weigh depth vs breadth. A common compromise is to sequence many cells from a few individuals and fewer cells (or just bulk) from many individuals. For example, a disease study might do in-depth single-cell profiling on 10 patients and bulk RNA-seq on 100 patients. This ties back to integration – using each where appropriate.
Batch effects are amplified with large-scale single-cell projects. Each 10x run or each sample processed on a different day could introduce a batch. In multi-center projects, differences in tissue handling or library prep between labs can also cause batch variation. Batch effects in scRNA-seq often manifest as cells clustering by donor or batch rather than cell type, which can obscure the biology if not corrected. Methods like Harmony or Seurat v3 integration that emerged around 2019 have been crucial for enabling the creation of large integrated atlases of cells from many sources. These methods project cells into a shared space where batch differences are mitigated. However, over-correction is a concern too (removing real biological differences that align with batch by coincidence, e.g. if one batch is all disease and another all control, batch and biology are confounded). Careful experimental design (e.g. multiplexing samples in the same batch, using reference controls) and computational diligence are needed.
For bulk RNA-seq, batch effects are usually easier to manage – including batch as a covariate in differential expression models is standard, and the relative simplicity of bulk data means even if a batch has a slightly higher library size or GC content, it can be normalized out. There are cases where bulk batch effects are troublesome (lab-specific differences in tissue processing can overshadow subtle disease signals), but generally one can detect and adjust for them with established techniques.
Scalability of data interpretation is another aspect: single-cell studies yield dozens of clusters, each of which might have its own story. How to summarize these results for interpretation or for comparison to bulk? Researchers sometimes collapse clusters into major cell types or use higher-level patterns (e.g. an increase in immune cells proportion in disease, or a particular cell state emerging). There is a need for frameworks to compare scRNA-seq results across studies (since each study might define clusters slightly differently) – analogous to how bulk studies can be meta-analyzed by aligning gene signatures. Initiatives to standardize cell type nomenclature and create reference cell atlases help address this.
Throughput improvements: On the experimental side, innovations like combinatorial indexing (sci-RNA-seq) and plate-based multi-index methods have increased throughput of single-cell profiling, meaning larger datasets will continue to be generated. Single-nucleus methods have allowed usage of frozen tissue banks, unleashing a wave of human single-cell data from archived samples (especially in brain, as seen in 2019–2022 with large-scale snRNA-seq of human cerebral cortex). These large datasets often require novel computational solutions and data sharing methods (storing raw data for a million single cells is non-trivial, often in the tens of terabytes).
Cost also differentiates approaches: Bulk RNA-seq is much cheaper per sample, which is why you see some studies with thousands of bulk RNA-seq samples (e.g. large clinical trials or population studies). Single-cell sequencing costs have dropped but are still significant per cell/sample combination. This means that for certain applications (like diagnostics or clinical decision-making), bulk assays or targeted panels remain more practical, whereas single-cell is used in research settings to get insights that can then be distilled into cheaper tests.
In terms of automation and reproducibility, bulk RNA-seq is highly standardized now – one can send RNA to a service and get back consistent data. Single-cell protocols have more steps and potential variability (cell dissociation quality, cell viability, etc.), though commercial platforms have improved reproducibility. The community has developed best-practices (e.g. using multiple biological replicates, including spike-ins or “multiplet” rate controls, etc.) to ensure single-cell data quality.
Current Gaps, Underexplored Areas, and Emerging Innovations
Despite the tremendous progress in both bulk and single-cell transcriptomics, there remain notable gaps and opportunities for further innovation:
-
Integration of multi-modal data: We are only beginning to tap the potential of combining transcriptomics with other omics at single-cell resolution. For example, single-cell multi-omics methods (simultaneously measuring RNA and DNA methylation, or RNA and chromatin accessibility in the same cell) have been developed (10x Multiome, SNARE-seq, etc.), but their use in large human studies is nascent. Integrating these data could link gene expression differences to epigenetic mechanisms cell-by-cell. Similarly, measuring protein via antibodies in single cells (CITE-seq or CyTOF) along with RNA gives a more complete picture of cell phenotype. Emerging innovation: joint profiling of genotype and transcriptome in single cells (e.g. DNA-seq + RNA-seq in the same cell) – a 2025 report demonstrates co-sequencing of RNA and DNA from individual nuclei. This could allow connecting mutations to gene expression in cells of a tumor, something bulk cannot do without averaging.
-
Spatially resolved single-cell transcriptomics: Current spatial transcriptomics technologies trade off resolution and throughput – e.g. Visium has high throughput but spots ~50µm containing multiple cells, while single-molecule in situ methods like MERFISH or seqFISH have true single-cell resolution but so far lower genomic breadth. An anticipated innovation is the convergence toward high-throughput, genome-wide, single-cell resolution spatial transcriptomics. Progress is being made (e.g. improved spot size, or high-density barcoded arrays). Once that is achieved, one could imagine profiling an entire tissue section at single-cell resolution, effectively doing scRNA-seq with preserved spatial context. This would address one of the big limitations of both bulk and dissociated scRNA-seq – the loss of spatial information. It would also largely obviate the need for separate spatial vs single-cell experiments and allow direct mapping of cell interactions in situ. In the interim, more studies could combine spatial + scRNA-seq (which is still underutilized, though growing).
-
Long-read RNA-seq at single-cell level: Bulk RNA-seq has benefited from long-read sequencing (PacBio, Nanopore) to resolve full-length isoforms and novel splicing. Bringing long-read to single-cell is challenging due to the tiny amount of RNA per cell, but early attempts (like Nanopore sequencing of single-cell cDNA) are emerging. This could open up isoform-level single-cell analysis, identifying cell-type-specific splice variants or fusion transcripts that bulk finds but cannot localize to specific cells.
-
Temporal dynamics in vivo: scRNA-seq gives snapshots; bulk time-course experiments give average trajectories. A gap is tracking the same cells or clones over time in humans (not really possible directly). However, lineage tracing in model systems or using pseudotime inference in cross-sectional human data are proxies. One underexplored area is applying single-cell techniques to longitudinal samples from patients (for example, serial biopsies before and after a treatment). Bulk RNA-seq has often been used in longitudinal studies, but single-cell longitudinal data could reveal how individual cell populations expand, contract, or change gene expression in response to therapy. Some cancer studies are starting to do this (tumor biopsy scRNA-seq pre- and post-therapy). The data are complex (since they are paired samples with different cells each time), but analyses can track inferred cell type frequency changes and phenotypic changes. This is an area for further methodological development (e.g. algorithms for “tracking” cell states across time points).
-
Underexplored tissue contexts: While single-cell transcriptomics has been applied to many organs, some remain less explored or present unique challenges. For example, adult human tissues like bone (marrow aside), intestine with microbiome, or reproductive organs might need optimized protocols. Bulk RNA-seq data exist for nearly every tissue (thanks to projects like GTEx), but single-cell atlases are still incomplete for certain organs, especially under various conditions (healthy, disease, aging). There is a gap in deeply profiling older adult tissues at single-cell resolution to understand aging, for instance. Bulk data show age-related expression changes; single-cell could attribute those to changes in cell type composition (e.g. more senescent cells) versus intrinsic changes.
-
Analytical methods for cell–cell communication: While many tools predict ligand-receptor pairs, few provide quantitative or causal validation. It remains underexplored how to integrate single-cell transcriptomics with functional assays or spatial proximity data to truly confirm predicted interactions. Multi-modal data such as spatial co-localization or perturbations (like organoid experiments where a certain cell type is removed) can strengthen interaction hypotheses. The field would benefit from methods that integrate transcriptomics with cell proximity information (from spatial data) to filter biologically relevant interactions.
-
Bulk and single-cell network integration: Bulk RNA-seq has been used to construct co-expression networks (modules of genes). Single-cell data could refine these by ensuring modules correspond to single-cell gene programs rather than mixed ones. An underexplored idea is to overlap co-expression networks from bulk with the clustering of genes by cell in single-cell (i.e. seeing if bulk modules map to specific cell types’ programs). Some initial attempts show that many bulk co-expression modules correlate with single-cell cluster markers, but not always – indicating some bulk modules are composites of multi-cell type signals. Developing approaches to decompose bulk networks into cell-specific networks using single-cell data could improve our understanding of tissue-level regulation.
-
Clinical translation gap: Bulk RNA-seq is already being tested in clinical diagnostic settings (for example, using bulk gene expression signatures to classify tumors or to predict transplant rejection). scRNA-seq is far from clinical use due to complexity. However, insights from single-cell studies could be translated into clinical biomarkers – e.g. identifying a small set of marker genes that indicate the presence of a certain pathogenic cell type, which can then be measured by simpler means (PCR or immunohistochemistry). This pipeline from single-cell discovery to bulk-based diagnostic is still underdeveloped. A hypothesis is that many complex diseases have specific cellular culprits that could serve as biomarkers if we knew how to measure them. Single-cell studies are starting to reveal such culprits (like specific exhausted T cell subsets in cancer immunotherapy response), so a next step is converting those into bulk “surrogate” assays (like a 10-gene panel that captures that subset’s presence). This requires careful validation.
-
Single-nucleus vs single-cell nuances: It remains a somewhat underexplored question how snRNA-seq vs scRNA-seq differ in certain contexts beyond the technical. For example, do they reveal identical cell type landscapes in all tissues? Are some cell activation markers consistently lower in snRNA-seq (because some of that mRNA is in cytoplasm)? Studies like the one by Bakken et al. (2018) addressed this for brain, but for other tissues (liver, kidney, etc.) systematic comparisons are fewer. As snRNA-seq becomes more common, it will be important to map its results onto scRNA-seq results. The literature suggests they are largely concordant if analysis is done right, but small differences (like stress-response gene expression, or detection of transcripts from distant axons) could be biologically meaningful. A gap is the lack of unified references that integrate both sc and sn data – some new atlases are doing this, combining nuclei and cells to get a complete cell catalog.
-
Data and model sharing: With the deluge of single-cell data, a challenge is how to share and reuse these effectively. Bulk RNA-seq had standardized formats (counts matrix, etc.) and large repositories (GEO, Expression Atlas). Single-cell data, due to size and complexity, sometimes are shared as processed downsampled objects or not at all. The community is moving towards better sharing (e.g. the Loom format or AnnData for sharing count matrices plus metadata), but it’s not yet as seamless as bulk data sharing. Improved standards here will allow more meta-analyses and integration across studies (like combining many single-cell studies of a disease to increase power, analogous to meta-analysis of bulk studies).
-
Computational speed: Many single-cell algorithms still struggle with very large datasets. There is room for innovation in algorithmic efficiency – possibly taking cues from big data analytics outside of biology. For example, developing streaming algorithms for clustering (so data need not be loaded all at once), or using GPUs for key steps, or novel dimensionality reduction methods for >1e6 cells. For bulk data, most computational challenges are solved (alignment is the slowest part, but even that is manageable with modern tools; quantification can be done pseudo-aligned in minutes per sample). Single-cell analysis could similarly be made routine with better optimized pipelines.
-
Underexplored combinations: The prompt specifically mentions spatial + scRNA-seq + bulk together – indeed, few studies have combined all three, representing a multi-scale approach that is just emerging. Another underexplored combo is single-cell transcriptomics + in vivo lineage tracing in human tissue – which is hard, but one approach is to use somatic mutations as natural barcodes to infer lineage (e.g. in tumors, combining single-cell RNA with genotyping to link clonal lineage to expression; some have done this with high coverage of mutation sites). Additionally, combining single-cell with longitudinal bulk (taking advantage of the fact bulk can be done repeatedly when single-cell cannot) could be explored: e.g. use bulk RNA-seq as a time-series and scRNA-seq at key endpoints to interpret those time trends.
-
Emerging single-cell perturbation screens: Techniques like Perturb-seq (CRISPR perturbations with scRNA-seq readout) are giving causal insights at single-cell level. While mostly in vitro so far, they could be applied to primary human cells to test functions of genes in specific cell types. Bulk readouts of perturbations average effects across cell types, but single-cell readouts let one see which cell type responded. This is an innovation bridging genomics and functional genetics and will likely yield new discovery frameworks (e.g. systematically testing regulatory factors in certain cell states).
In summary, the frontier lies in multi-dimensional integration (combining modalities and scales) and in addressing limitations of each modality (improving single-cell quantitative accuracy, adding spatial context, etc.). These will guide the next phase of transcriptomic research, moving from simple profiling toward truly comprehensive, multi-layered understanding of biological systems.
Conclusion
Bulk, single-cell, and single-nucleus RNA sequencing each provide a unique lens on the transcriptome. Bulk RNA-seq offers reliable quantification of gene expression at the tissue level and remains indispensable for large-scale studies and clinical applications, but it conflates signals from diverse cells. Single-cell and single-nucleus RNA-seq reveal the rich tapestry of cell types and states within tissues, unmasking heterogeneity, rare cells, and cell-specific expression patterns that bulk approaches cannot resolve. Over the past five years, human studies leveraging these technologies have transformed our understanding of complex tissues – from tumors to brains to hearts – by identifying the cellular players and interactions underlying bulk tissue phenotypes. We have also seen that these approaches are complementary: when used together, they can connect molecular changes from the single-cell scale to organism-level outcomes. Integration with spatial transcriptomics and other modalities further enhances this multi-scale insight, albeit with new analytical challenges.
There are still gaps in methods and knowledge, but ongoing innovations (in technology, computation, and experimental design) aim to close these. The field is moving toward a synthesis where bulk and single-cell data aren’t seen as separate, but rather as pieces of an interconnected puzzle: bulk defines the big picture, single-cell fills in the details, and spatial and other omics add additional layers of context. As these pieces come together, we can formulate more informed hypotheses about biology and disease. In the next section, we propose a research project that builds on all these insights, illustrating how one might practically leverage bulk, single-cell, and single-nucleus sequencing together to break new ground.
Proposed Research Project Plan: Multi-Modal Transcriptomic Dissection of Human Heart Failure
Objective: This project aims to integrate bulk RNA-seq, single-nucleus RNA-seq, and spatial transcriptomics to comprehensively characterize the cellular and molecular changes in human heart failure. By leveraging insights from bulk vs single-cell modalities, we seek to (1) identify cell-type-specific gene expression changes and rare pathogenic cell states in failing human hearts, (2) map the spatial organization of these cell types/states within heart tissue, and (3) link these findings to bulk transcriptomic signatures and clinical outcomes. The ultimate goal is to uncover how cellular heterogeneity and interactions drive the bulk tissue remodeling in heart failure, and to discover novel cell-type-specific therapeutic targets or biomarkers.
Rationale: Heart failure (HF) is a complex syndrome involving changes in cardiomyocytes, fibrosis by myofibroblasts, vascular remodeling, and immune cell infiltration. Bulk RNA-seq of failing vs healthy hearts has identified many differentially expressed genes and pathways (e.g. extracellular matrix genes, fetal gene program reactivation), but bulk data cannot tell which cell types are responsible. Recent single-cell studies suggest heterogeneous fibroblast and immune cell subpopulations in the heart that could have distinct roles in disease. Many questions remain underexplored: Which specific cell types or states drive pathological fibrosis? Are there rare cardiomyocyte subpopulations uniquely present or expanded in HF? How do cell–cell interactions (e.g. between fibroblasts and cardiomyocytes or immune cells) contribute to cardiac dysfunction? And critically, how do these cellular insights correlate with patient-level phenotypes observable in bulk tissue or blood assays? By integrating multi-modal transcriptomic data, we can address these questions. Bulk RNA-seq on a larger patient cohort will establish the generalizable gene signatures of HF and allow correlation with clinical data. Single-nucleus RNA-seq (snRNA-seq) on a subset of hearts will reveal the cellular composition and states underlying those signatures, including any rare but important cell populations (snRNA-seq is chosen because human cardiac tissue is difficult to dissociate and often available frozen). Spatial transcriptomics will add the crucial dimension of where in the heart tissue these cells and signals reside (e.g. fibrotic scar vs viable myocardium). Combining these, we expect to identify, for example, a specific subset of activated fibroblasts enriched in scars that overexpress profibrotic factors (detected in single-nucleus and spatial data) and see that the bulk expression of their signature correlates with worse heart function across patients. Such findings can generate new hypotheses (e.g. targeting that fibroblast subset or its signals).
Methodology:
-
Sample Collection: We will collect left ventricular tissue samples from n = 30 heart failure patients (during left-ventricular assist device implantation or transplant) and n = 10 non-failing donor hearts (unused transplant donor hearts as controls). Each sample will be divided for three assays: one piece flash-frozen for bulk RNA-seq, one for nuclei isolation (snRNA-seq), and one embedded for spatial transcriptomics. Using the same individuals for all modalities allows direct integration.
-
Bulk RNA-Seq: Perform bulk RNA sequencing on all 40 samples (poly-A selected, deep sequencing to ~50 million reads per sample). This will yield differential gene expression between failing and non-failing hearts and identify dysregulated pathways (baseline expectation from literature: upregulation of fibrosis, inflammation genes; downregulation of contraction, metabolic genes). We will also correlate bulk expression profiles with clinical metrics (e.g. ejection fraction, fibrosis extent by pathology) to find gene signatures associated with severity.
-
Single-Nucleus RNA-Seq: From a subset of ~10 HF and ~5 control hearts (limited by feasibility), isolate nuclei (using Dounce homogenization and gradient to enrich nuclei, as per established protocols for heart tissue). Apply a high-throughput droplet snRNA-seq method (10x Genomics nuclei protocol) to profile ~5,000–10,000 nuclei per heart. Library prep will include intronic reads capture to improve gene detection. The data will be processed to identify major cell types: cardiomyocytes, fibroblasts, endothelial cells, smooth muscle, macrophages, T cells, etc., each potentially splitting into subclusters (e.g. fibroblasts into subtypes). We will especially look for cell states known or suspected in HF: activated myofibroblasts (expressing collagen, POSTN), endothelial-to-mesenchymal transitioning cells, proliferating cells, pro-inflammatory vs anti-inflammatory macrophages, stressed cardiomyocytes expressing fetal genes, etc. Differential expression analysis will be done between HF vs control within each cell type (pseudo-bulk per individual per cell type), to pinpoint changes like “fibroblasts in HF upregulate IL-6 and TGF-β pathway genes relative to fibroblasts in controls.” We will also use trajectory analysis if applicable (e.g. see if we can order fibroblasts from quiescent to activated states).
-
Spatial Transcriptomics: Utilize 10x Visium on adjacent sections from the same hearts used in snRNA-seq. We’ll select areas including scar tissue and myocardium. This will produce spatial spots (55 µm diameter) with gene expression. We will apply integration with the snRNA-seq data: using the snRNA-seq cell type signatures to deconvolute the spatial spots (e.g. using tools like Seurat’s label transfer or Tangram). This will yield a spatial map of cell type distribution. We can then visualize where the activated fibroblast cluster is located – e.g. predominantly in subendocardial fibrosis or diffuse. Additionally, spatial data will allow identification of cell neighborhoods, such as clusters of macrophages adjacent to fibroblasts in scars, etc. We plan to validate key observations with immunofluorescence on serial sections (for example, staining for a marker of the novel fibroblast subset to see its localization and abundance).
-
Data Integration: We will integrate the three datasets at multiple levels:
- Use single-nucleus data to deconvolute bulk expression: for each bulk sample, estimate cell type proportions and cell-type-specific expression contributions. Test if these explain the bulk DE results (e.g. bulk upregulation of collagen genes might be explained by increased proportion of activated fibroblasts).
- Map bulk differential genes to cell types: For each gene significantly changed in bulk HF vs control, check in snRNA-seq which cell types express that gene and whether it’s upregulated in HF in those cells. This creates a cell type annotation of bulk signatures (e.g. “the bulk HF-upregulated genes are enriched for fibroblast-derived genes”).
- Compare bulk pathway analysis vs cell-specific pathway analysis: Do pathways enriched in bulk (e.g. TNF signaling) correspond to specific cell types? If bulk pathway X is up, see which cell type shows that via single-cell. This can reveal if a pathway is cell-type restricted or broadly active.
- Integrate spatially: Co-visualize spatial expression of key bulk signature genes and the presence of cell types. For example, if the bulk data says “NPPB (BNP gene) is 4-fold up in HF”, we can see in spatial which regions and cell types (cardiomyocytes, presumably) express NPPB; this ties a bulk biomarker to its cellular source and anatomical context.
-
Validation and Hypothesis Testing: Based on integrated results, we will formulate hypotheses such as “A specific subtype of fibroblast (marked by gene X) expands in HF and drives extracellular matrix deposition via ligand Y interacting with macrophage receptor Z.” We will validate parts of this experimentally: e.g. perform in situ hybridization or immunostaining for gene X and Y to confirm co-localization of that fibroblast subtype with macrophages in human heart tissue. If possible, in vitro co-culture experiments could be done: take primary human fibroblasts and macrophages, stimulate via ligand-receptor pair to see if predicted signals induce expected gene expression changes (mimicking the interaction inferred from single-cell data).
-
Clinical correlation: Using bulk RNA-seq from a larger set of HF patients (if available from public data or additional samples), we will check if the abundance of the discovered cell-type signature correlates with clinical outcomes (survival, hospitalization, etc.). We can create a “fibroblast activation score” from the top genes of the activated fibroblast cluster and compute it in bulk datasets to see its prognostic value. This connects the single-cell finding to a potential biomarker measurable in bulk data (and eventually possibly in blood as secreted factors).
-
Analytical tools: We will employ or develop custom bioinformatic pipelines for integration. For example, use Harmony or Seurat v4 to integrate snRNA-seq data across donors (to mitigate batch and focus on disease vs control differences). Use CIBERSORTx or Bisque for bulk deconvolution. Use CellPhoneDB or NicheNet for ligand-receptor analysis between cell types in snRNA-seq, especially focusing on interactions that could explain bulk pathways (e.g. if bulk data shows “NF-κB pathway up”, check if TNF ligand from one cell type and TNF receptor on another are expressed). We’ll also leverage machine learning to integrate data: e.g. train a classifier on single-cell data to recognize HF vs control at cell level, and apply it to bulk data deconvolved cell profiles. This is exploratory.
Anticipated Results and Contributions:
-
We expect to produce the first integrated atlas of the failing human heart that links cell-type changes to bulk tissue changes. Concretely, we anticipate identifying:
- One or more fibroblast subpopulations expanded in heart failure (e.g. a myofibroblast subtype expressing high collagen, periostin, etc.) and pinpoint their location (perhaps clustering in fibrotic regions). This would extend prior bulk knowledge of fibrosis by assigning it to a specific cell subset.
- Alterations in cardiomyocytes, such as embryonic gene re-expression (NPPB, ACTA1 etc.) in a subset of cardiomyocytes in HF. Bulk shows fetal gene reactivation, but single-cell might show only a fraction of cardiomyocytes (maybe those near scar or under more stress) upregulate those genes.
- Immune cell involvement, e.g. an inflammatory macrophage cluster that appears in HF hearts producing cytokines (IL-1β, TNF) that stimulate fibroblasts. We may discover a small population of T cells or macrophages that orchestrate inflammation, which bulk heart RNA-seq hinted at by showing cytokine transcripts but could not attribute.
- Endothelial and smooth muscle changes, such as endothelial-to-mesenchymal transition (EndMT) contributing to fibroblast pool, detectable by cells co-expressing endothelial and mesenchymal markers in snRNA-seq. Bulk data alone can’t easily detect EndMT, but single-cell might.
- Spatial context: confirmation that fibroblast-rich spots coincide with loss of cardiomyocytes (scar), that macrophages aggregate there, etc., giving a histological dimension to the transcriptomic findings.
-
Innovative Integration Methodology: Method-wise, our project will demonstrate a pipeline for multi-modal data integration in a human disease context. We will document the processes of aligning bulk and single-cell results – effectively providing a case study that could be generalized to other tissues. Any novel analysis methods we create (for example, a pipeline to map bulk DE genes onto single-cell cell types systematically) will be shared as open-source code for use in other studies. This contributes to the bioinformatics toolkit for multi-scale integration.
-
Hypothesis Generation for Intervention: The findings may highlight specific molecular interactions as potential therapeutic targets. For instance, if we find that fibroblast subset expresses high TGF-β2 and that is spatially near myocytes with TGF-β signaling activation, it suggests targeting TGF-β in fibroblasts might prevent cardiomyocyte dysfunction. Or identification of a chemokine CCL2 from stressed myocytes attracting macrophages could suggest blocking that axis to reduce inflammation. These hypotheses, derived from integrated data, could guide future experimental studies or drug development.
-
Biomarker Identification: Through correlation of single-cell signatures with bulk and clinical data, we might propose a set of marker genes measurable in tissue or even blood (some may encode secreted proteins or enriched extracellular matrix components) that indicate the presence of deleterious cell states. For example, POSTN (periostin) is a fibroblast-derived matrix protein; if we find it’s specific to pathological fibroblasts and correlates with HF severity (and it’s detectable in blood or biopsy), it could be a biomarker for fibrosis extent.
-
Published Atlas and Dataset: We will publish a comprehensive dataset including raw and processed bulk RNA-seq, snRNA-seq, and spatial transcriptomics for these hearts, providing a resource for the community. This dataset can be mined for other questions (e.g. genetic variant effects on cell-specific expression, etc.) and stands as a reference for heart failure single-cell transcriptomics (complementing existing atlases of the healthy heart). We expect high interest, as integrated multi-modal human heart data of this kind have not been widely available.
In conclusion, this project leverages the complementary strengths of bulk, single-nucleus, and spatial transcriptomic profiling to advance our understanding of heart failure. It embodies the lessons from recent literature: using single-cell resolution to decode bulk signals, using bulk to validate and generalize single-cell discoveries, and adding spatial context to preserve tissue architecture information. The anticipated outcomes – a multi-modal heart failure atlas and new mechanistic insights – could not be achieved by any one modality alone, underscoring the value of an integrative approach. Ultimately, this research direction exemplifies how bridging scales (from molecules in single cells to whole-organ changes) can guide us toward more precise biomarkers and therapies for complex diseases like heart failure. The framework developed here can be applied to other diseases, heralding a new era of holistic, multi-scale biomedical research guided by transcriptomics.